Planar Development of Free-Form Surfaces: Quality Evaluation and Visual Inspection
azar@aegean.gr sapidis@aegean.gr
1 Test cases
1.1 Color Maps
All local, geometric accuracy-indices (Section
3.3.1) are presented to the user through appropriate color maps. More
specifically, application of a particular quality criterion commences with
calculation of the corresponding accuracy index at each vertex of the planar
development through averaging of values produced by all triangles sharing this
vertex. This value is then projected onto the
![]() interval
and, using an appropriate color model, it is eventually associated to a color
value expressed as a triple of Red, Green and Blue components defined on
interval
and, using an appropriate color model, it is eventually associated to a color
value expressed as a triple of Red, Green and Blue components defined on
![]() .
In the present implementation, the mapping
.
In the present implementation, the mapping
![]() is
accomplished using a 1st degree B-spline with control points (0,0,1), (0,1,1),
(0,1,0), (1,1,0), (1,0,0), (1,0,1) and with a chord-length parameterization.
Thus, the minimum value (zero) corresponds to pure Blue, while the maximum (one)
to Magenta. All examples, presented in this section, are based on this color-map
model.
is
accomplished using a 1st degree B-spline with control points (0,0,1), (0,1,1),
(0,1,0), (1,1,0), (1,0,0), (1,0,1) and with a chord-length parameterization.
Thus, the minimum value (zero) corresponds to pure Blue, while the maximum (one)
to Magenta. All examples, presented in this section, are based on this color-map
model.
1.2 Examples
The quality-control criteria and visualization methods, introduced in the previous sections of this paper, are applied to planar developments of varying quality to confirm/demonstrate their effectiveness in identifying inaccuracies. All numerical results related to the present examples are assembled in a single table (Table 1) to facilitate comparisons. Color images are presented separately for each example.
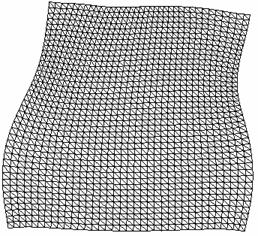
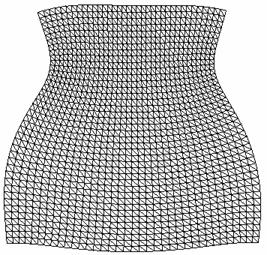
The first example is the classical surface used for benchmarking flattening methods: a torus part (Fig. 3). We shall perform quality control on two planar developments of this surface derived using the method [19]. In order to illustrate the effectiveness of the proposed tools in detecting accuracy problems, we produce (a) a suboptimal development by forcing the method to terminate prematurely, and (b) a high-quality development using the method appropriately. The resulting planar developments are shown in Fig.4a and Fig.4b respectively.
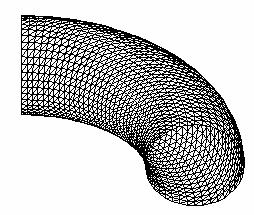
Fig.3. Part of a torus surface.
For the first
planar development (Fig.4a): Since the local isometry index
![]() takes
values up to 0.76113, meaning that there exist triangles distorted up to 76%, it
is evident that this planar development is not accurate. However, distortion is
dispread within this planar development quite uniformly, except for the two
areas in Fig. 5 colored in orange/red where
takes
values up to 0.76113, meaning that there exist triangles distorted up to 76%, it
is evident that this planar development is not accurate. However, distortion is
dispread within this planar development quite uniformly, except for the two
areas in Fig. 5 colored in orange/red where
![]() reaches
local maxima, i.e., there is a high concentration of deformation. Figure 6
depicts a color map of the local aspect ratio index
reaches
local maxima, i.e., there is a high concentration of deformation. Figure 6
depicts a color map of the local aspect ratio index
![]() (Eq.
(19)) together with the nodal forces (Section 4). It is obvious that significant
distortion exists near the upper-right corner of the planar development, where
also excessive stretching forces appear. In general, high
(Eq.
(19)) together with the nodal forces (Section 4). It is obvious that significant
distortion exists near the upper-right corner of the planar development, where
also excessive stretching forces appear. In general, high
![]() appears
in areas where shear stress exists, as it is shown at the upper-right corner of
Fig. 6(right). Conclusion: All criteria agree that the development in Fig.
4(a) is not accurate and thus inappropriate for applications. To confirm
this, we use this planar development to map a texture pattern onto the
corresponding toroidal surface using the method [2]. The texture pattern is
monochrome and consists of uniformly distributed black circular-disks. The
texture mapped image (Fig. 7) identifies vividly the parts of the surface
corresponding to distorted areas of the planar development. Indeed, in the
heavily distorted areas where
appears
in areas where shear stress exists, as it is shown at the upper-right corner of
Fig. 6(right). Conclusion: All criteria agree that the development in Fig.
4(a) is not accurate and thus inappropriate for applications. To confirm
this, we use this planar development to map a texture pattern onto the
corresponding toroidal surface using the method [2]. The texture pattern is
monochrome and consists of uniformly distributed black circular-disks. The
texture mapped image (Fig. 7) identifies vividly the parts of the surface
corresponding to distorted areas of the planar development. Indeed, in the
heavily distorted areas where ![]() is
high, the circles of the pattern are also distorted into elliptical shapes. It
is interesting to note that the orientation of the ‘‘ellipses’’ agrees with that
of the calculated nodal forces.
is
high, the circles of the pattern are also distorted into elliptical shapes. It
is interesting to note that the orientation of the ‘‘ellipses’’ agrees with that
of the calculated nodal forces.
a b
Fig.4. Planar developments of the surface in Fig. 3 using the method [19] : (a) suboptimal development, (b) high-quality development.
Fig.5.
Color map of the
![]() index.
index.
Fig.6. Color map of the
![]() index.
index.
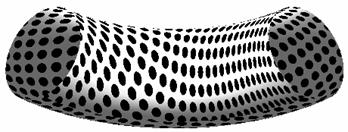
Fig.7. Texture mapped image on the torus part using the planar development of Fig.5.
Applying the same
quality-control methods on the second planar development (Fig. 4b) reveals its
high quality/accuracy, indicated, e.g., by all indices in Table 1. Figure 8
agrees with this observation as the maximum
![]() value
is significantly lower than that of Fig. 6. Furthermore, nodal forces along
vertical boundaries appear almost symmetrical as one would expect based on the
symmetry of the toroidal surface. However, there is an area near the middle of
the horizontal boundaries where
value
is significantly lower than that of Fig. 6. Furthermore, nodal forces along
vertical boundaries appear almost symmetrical as one would expect based on the
symmetry of the toroidal surface. However, there is an area near the middle of
the horizontal boundaries where ![]() is
quite high, indicating a deformation of the aspect ratio. This deformation is
confirmed by the texture mapped image (Fig. 9), generated using this second
development. Indeed, in Fig. 9 the result is quite satisfactory everywhere
except for the indicated part corresponding to the area discussed above.
is
quite high, indicating a deformation of the aspect ratio. This deformation is
confirmed by the texture mapped image (Fig. 9), generated using this second
development. Indeed, in Fig. 9 the result is quite satisfactory everywhere
except for the indicated part corresponding to the area discussed above.
Fig.8.
Color map of the ![]() index.
index.
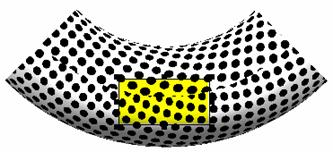
Fig.9. Texture mapped image of the torus part using the second planar development.
As a second test
case we use an example from the footwear industry: flattening of the surface of
a last (Fig. 10). We flatten the last using the global optimization method under
constrains [3] making sure that the method terminates prematurely, so that the
result is not accurate; see Fig. 10. The numerical indicators in Table 1 agree
with that; e.g., ![]() indicates
up to 58% distortion of triangle-edges. Furthermore, the color maps in Figs. 11
and 12 also identify inaccuracies at the forepart and at the perimeter of the
surface, respectively. These results are empirically confirmed through the
texture mapped image of the last illustrated in Fig. 12, where significant
deformation of the pattern is shown at the forepart.
indicates
up to 58% distortion of triangle-edges. Furthermore, the color maps in Figs. 11
and 12 also identify inaccuracies at the forepart and at the perimeter of the
surface, respectively. These results are empirically confirmed through the
texture mapped image of the last illustrated in Fig. 12, where significant
deformation of the pattern is shown at the forepart.
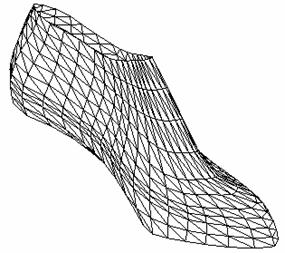
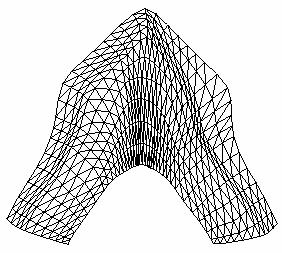
Fig.10. Surface of a last and the corresponding planar development.
Fig.11.
Color map of the ![]() index.
index.
Fig.12.
Color map of the ![]() index.
index.
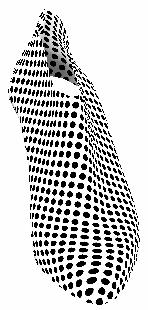
Fig.13. Texture mapped image last surface.
The third example tests our proposals on a highly complex surface, the human-head model in Fig. 14. The corresponding planar development is derived using the method [13]. All indices in Table 1 indicate significant inaccuracies in this development. The problematic areas are highlighted by the color maps of Figs. 15 and 16: The former points out inaccuracies at the area of the nose, while the latter indicates non-uniform deformations near the nose and in the neck area. These observations are empirically confirmed by texture mapping; see the two marked areas in Fig. 17.
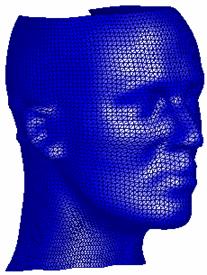
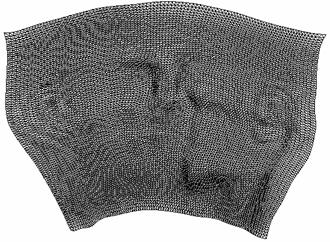
Fig.14. Human-head surface and the corresponding planar development.
Fig.15.
Color map of the ![]() quality
index.
quality
index.
Fig.16.
Color map of the
![]() quality
index.
quality
index.
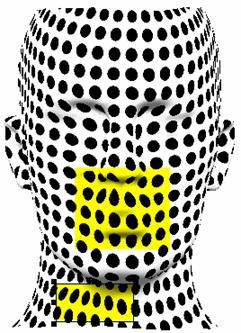
Fig.17. Texture mapped image on the human head with areas of maximum deformation colored yellow.
The final example
is the revolved surface in Fig. 18. All numerical indices in Table 1 agree that
this is an accurate development. The color map of
![]() indicates
a relatively uniform distribution of the distortion, while the
indicates
a relatively uniform distribution of the distortion, while the
![]() color
map points out two areas with a larger deformation of the aspect ratio; see Fig.
19 and 20. Figure 19 shows also the normalized force-vectors derived according
to Section 4, while Fig. 20 shows them in a non-normalized form. In the latter
figure we note that shear stresses exist in the vicinity of the areas with the
largest deformations. Again, we observe that there is a close relation between
the aspect ratio
color
map points out two areas with a larger deformation of the aspect ratio; see Fig.
19 and 20. Figure 19 shows also the normalized force-vectors derived according
to Section 4, while Fig. 20 shows them in a non-normalized form. In the latter
figure we note that shear stresses exist in the vicinity of the areas with the
largest deformations. Again, we observe that there is a close relation between
the aspect ratio ![]() and
the nodal forces as it was also observed in the first example of this section.
The above observations are also confirmed by the texture map in Fig. 21, which
indicates minor problems in the aforementioned areas.
and
the nodal forces as it was also observed in the first example of this section.
The above observations are also confirmed by the texture map in Fig. 21, which
indicates minor problems in the aforementioned areas.
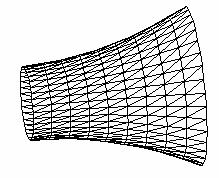
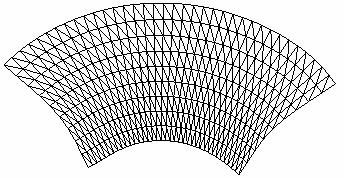
Fig.18. A revolved surface and its planar development.
Fig.19. Color map of the
![]() quality
index.
quality
index.
Fig.20. Color map of the
![]() quality
index.
quality
index.
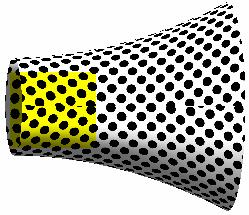
Fig.21. Texture mapped image on the revolved surface.
Table 1. Quality control results for the presented test cases
|
Surface |
Global homogeneity of distortion h |
Global aspect ratio r |
Min D(T) |
Max D(T) |
Min h(f) |
Max h(f) |
Min r(f) |
Max r(f) |
|
Torus (Fig.4a) |
5.8320x10⁻¹ |
5.0348x10⁻¹ |
4.3136x10⁻³ |
7.6113x10⁻¹ |
4.70x10⁻⁵ |
3.3475x10⁻¹ |
1.1436x10⁻³ |
8.3201x10⁻¹ |
|
Torus (Fig.4b) |
6.7021x10⁻¹ |
5.9186x10⁻¹ |
1.9551x10⁻³ |
4.65x10⁻¹ |
0 |
2.1468x10⁻¹ |
2.2811x10⁻³ |
4.1715x10⁻¹ |
|
Last |
3.4352x10⁻¹ |
3.8677x10⁻¹ |
3.0x10⁻⁶ |
5.8968x10⁻¹ |
2.0x10⁻⁶ |
1.1803 |
4.0x10⁻⁶ |
8.0225x10⁻¹ |
|
Head |
4.4526x10⁻¹ |
2.7456x10⁻¹ |
1.3031 |
1.7481 |
2.1625 |
6.1026 |
1.2208x10⁻³ |
2.0980 |
|
Revolved Surface |
8.1474x10⁻¹ |
7.8113x10⁻¹ |
3.112x10⁻³ |
1.5737x10⁻¹ |
8.26x10⁻⁵ |
1.6345x10⁻¹ |
4.979x10⁻³ |
1.8472x10⁻¹ |
References
1. Azariadis P., Aspragathos N. (1997), Design of Plane Patterns of Doubly Curved Surfaces, Computer-Aided Design 29(10), 675-685.
2. Azariadis P., Aspragathos N. (2000), On Using Planar Developments to Perform Texture Mapping on Arbitrarily Curved Surfaces, Computers & Graphics 24(4), 539-554.
3. Azariadis P., Aspragathos N. (2001), Geodesic Curvature Preservation In Surface Flattening Through Constrained Global Optimization, Computer-Aided Design 33(8), 581-591.
4. Azariadis P., Nearchou A., Aspragathos N. (2002), An Evolutionary Algorithm for Generating Planar Developments of Arbitrarily Curved Surfaces, Computers in Industry 47(3), 357-368.
5. Bennis C., Vezien J.-M., Iglesias G. (1991), Piecewise Surface Flattening for Non-Distorted Texture Mapping, Computer Graphics 25(4), 237-246.
6. Wang C., Chen S.-F., Yuen M. (2001), Surface Flattening for the Fashion Industry: A Generic Approach Using Spring-Mass System, Computers in Industry 1548, 1-10.
7. Wang C., Chen S.-F., Yuen M. (2002), Surface Flattening Based on Energy Model, Computer-Aided Design 34(11), 823-833.
8. Schwartz E.L, Shaw A., Wolfson E. (1989), A Numerical Solution to the Generalized Mapmaker's Problem: Flattening Nonconvex Polyhedral Surfaces, IEEE Trans. on Pattern Analysis and Machine Intelligence 11(9), 1005-1008.
9. Wolfson E., Schwartz E.L. (1989), Computing Mnimal Distances on Polyhedral Surfaces, IEEE Trans. on Pattern Analysis and Machine Intelligence 11(9), 1001-1005.
10. Yu G., Patrikalakis N.M., Maekawa T. (2000), Optimal Development of Doubly Curved Surfaces, Computer Aided Geometric Design 17(6), 545-577.
11. Hinds B.K., McCartney L., Woods G. (1991), Pattern Development for 3D Surfaces, Computer-Aided Design 23(8), 583-592.
12. Sammon J.W. (1969), A Nonlinear Mapping for Data Structure Analysis, IEEE Trans. on Computers 18(5), 401-409.
13. Maillot J., Yahia H., Verroust A. (1993), Interactive Texture Mapping, Proc. SIGGRAPH 93, Anaheim, California, 27-34.
14. Manning J.R. (1980), Computerized Pattern Cutting, Computer-Aided Design 12(1), 43-47.
15. McCartney J., Hinds B.K., Seow B.L. (1999), The Flattening of Triangulated Surfaces Incorporating Darts and Gussets, Computer-Aided Design 31(4), 249-260.
16. Parida L., Mudur S.P. (1993), Constraint-Satisfying Planar Development of Complex Surfaces, Computer-Aided Design 25(4), 225-232.
17. Sheffer, A., de Sturler, E. (2000), Parameterization of Faceted Surfaces for Meshing Using Angle Based Flattening, Engineering with Computers 17(3) 326-337.
18. Sheffer, A., de Sturler, E. (2002), Smoothing an Overlay Grid to Minimize Linear Distortion in Texture Mapping, ACM Transactions on Graphics 21(4), 874-890.
19. Shimada T., Tada Y. (1989), Development of Curved Surface Using Finite Element Method, Proc. 1st Int. Conf. Computer-Aided Optimum Design of Structures, Recent Advances, Springer, 23-30.
20. Shimada T., Tada Y. (1991), Approximate Transformation of an Arbitrary Curved Surface Into a Plane Using Dynamic Programming, Computer-Aided Design 23(2), 153-159.
21. Ma S.D., Lin H. (1998), Optimal Texture Mapping, Proc. EUROGRAPHICS 88, 421-428.
22. Zigelman G., Kimmel R., Kiryati N. (2002), Texture Mapping using Surface Flattening via Multi-Dimensional Scaling, IEEE Trans. on Visualization and Computer Graphics 8(2), 198-207.